
CASE STUDY 1
Embodied Energy Calculation Module A1-A5 of The Shire of Narembeen Administration Office Refurbishment
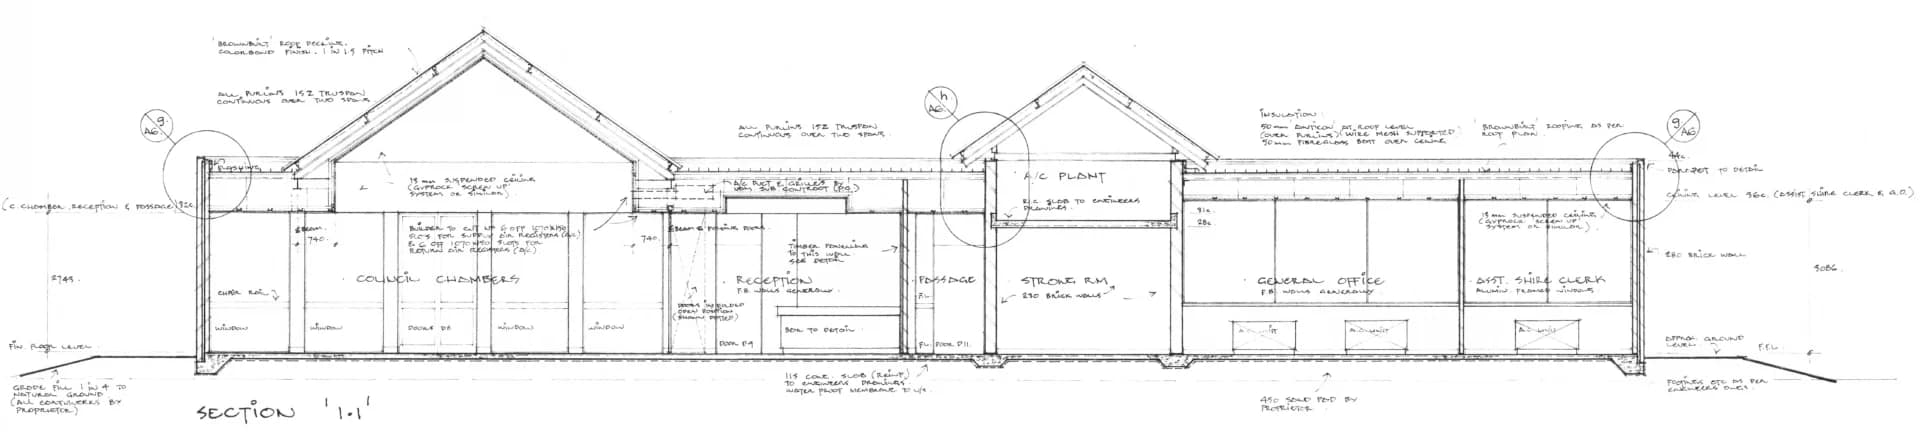
background
As part of ORA Sustainable Practice Development, we decided the largest impact we can contribute to the built environment is the reduction of Carbon Emission. And at the time of writing of this article, Embodied Energy becoming the most urgent issue to be addressed. We also discover there is a lack of free comprehensive guide, database and examples for the embodied measurement in Australia without using 3rd parties’ platforms. We decided to embark on our own journey to conduct the embodied calculation using all available resources to learn and form part of our design decision making process in relate to sustainability.
Tuan Ngo
|
|
Project Architect
1. Introduction
The case study in accordance with BS EN 15978 : 2011 (Assessment of Environmental performance of building and BS EN 15804 : 2019 (relate to EPD), which are used to define the amount of carbon released at different stages of a material or product life (Figure 1) from ‘A brief guide to calculating embodied carbon’ by www.thestructuralengineer.org
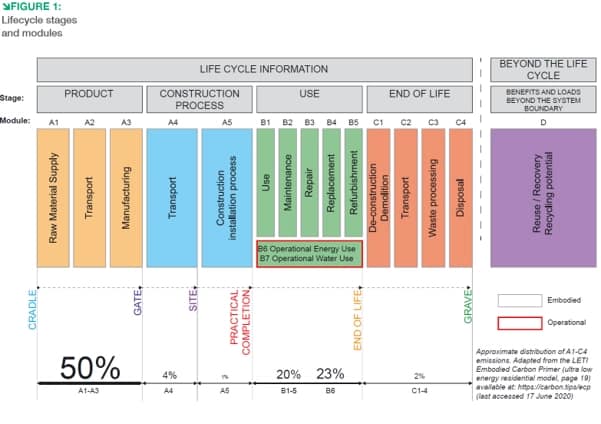
As we can see from Figure 1, modules A1 to A5 (embodied carbon) are estimated to be more than half of the embodied emission of the building during its life. The production of many common construction materials, such as cement, brick, steel, and aluminium, is expected to rely on fossil energy for quite a long time in future while the world is improving the efficiency of building operational energy and decarbonise electricity grid, the share of the embodied carbon only increases. Moreover, embodied energy is spent upfront, while operation energy is spent over a period of time. Addressing the upfront carbon becomes obvious in addressing the urgency of climate change and global warming potential.
Having said that, we recognise that the operation energy of the building (B1 – B5) still needs to be addressed especially in Australia; it is not the scope of this case study. Also, improving the thermal performance of the building has a diminishing return on both cost and carbon emission. Therefore, we will explore the balance between embodied and operation energy in a separate case study.
The embodied energy calculation in this case study is based on all the final documents for the Certificate of Design Compliance. During Design and Documentation, we considered many aspects of reducing the carbon footprint, from reducing and reusing to material choices, while balancing the Client brief and expectations and general good design. We will discuss these carbon emissions savings in our calculations.
We will also compare the Refurbishment with a New Construction of the same footprint to examine the differences in Embodied Carbon to further discuss our ethos in retaining and protecting existing building stock.
2. Data sources, assumptions and limitations:
As we learned during the process of this case study, not many construction materials in Australia have an Environmental Product Declaration (EPD). We only found and used the below Australian EPD in our calculation:
· Colorbond steel for roofing and walling – BlueScope steel
· Bondor roofing and walling panels
· Dulux Enviro02
· Rondo Products: Ceiling, Wall Framing and Finishing
· Fibre Cement Products from James Hardie Pty Ltd
· Knauf plasterboard Sheetrock HD13mm
· Laminex EPD-Melteca-Whiteboard-Particleboard Substrate-v1-1Mar24
· EPD – Hardwood Timber Wood Solution
· EPD – Softwood Timber Wood Solution
· EPD – Particleboard Wood Solution
Some materials and systems are extrapolated from other EU, US and International EPD:
· Translucent façade systems ‘Danpalone Façade Cladding” Everlite Concept
· Kilon Multiwall Panel: Kingspan Light + Air
· Multiwall Polycarbonate sheets: European Polycarbonate Sheet Extruders
· Aluminium & Window Systems: Altus Industrial Aluminium & Window Systems
· Tasman Insulation: Pink Batts glass wool insulation
· uPVC profiles for windows, doors and façade system: Thermalplastiki S.A.
· EPD Nylon on EcoFlex One – Mohawk Group Premium Modular Backing System
· EPD – Forbor Allura Flex Resilient Heterogeneous Vinyl floor Covering on Foam
The remaining materials, A1-A3, are from the NABERS National Emission Factor (EF) Data Base, with ‘uncertainty adjusted’ as the default. These EFs are considered higher than some other sources.
For example, C32/40 Concrete has A1-A3 ECF of 0.120 kgCO2e/Kg from the Table 2 of ‘A brief guide to calculating embodied carbon’ of www. thestructuralengineer.org
compared to the equivalent to 32Mpa Concrete has 0.195kgCO2e/kg in Australia from NABERS National Emission Factor Data Base.
Similarly, with Reinforce steel from the 2 sources: 1.99kgCO2e/Kg vs 3.65kg CO2e/Kg
We have not investigated the reasons for these differences and decided to take a precautionary approach.
Some materials such as door hardware, fixing, calking etc not been accounted for.
We made assumption that most existing wiring is retained, large part of existing air-conditioning services is retained. Hence, Services (Hydraulic, Mechanical and Electrical) emission is half of NABER m2 figure for Building Services of Office low rise.
3. Calculations
Note: Our Excel spreadsheet is available upon request. We kindly ask that you acknowledge us when using our spreadsheet and share your final product spreadsheet in return.
a. Default Trasport emission factor (Module A4):
Emissions from material transportation to the site (A4) are complex but worth discussing. Perth, the most isolated metropolitan area in the world, contributes significantly to its emissions from importing and exporting its products. A significant factor, and worth mentioning, is that it’s steel, aluminium and glass products, are mostly imported from Asia, such as China, Korea, Malaysia, etc. At the same time, most of it is exported as raw minerals such as iron ore. Australian-made steel currently comes from the Eastern States; steel products in the Perth Metro and surrounding regions come from long distances. Similarly to aluminium extrusion and aluminium billet, fibre cement sheets. Polycarbonate sheet (Danpalon brand) comes from Israel, which has the longest distance and highest Transportation emission per kg which will be discussed in detail in the report.
The project is in Narembeen 285km from Perth. Many materials and trades travel long distances to the site, predominantly using trucks. This significantly contributes to the transport of embodied carbon (A4). There is also travel cost for the contractors; we assumed
the contractor would source the closest material supplier and trade to increase their profits and for practical and technological reasons such as concrete time travel from plant to site.
Materials locally produced (Perth Metropolitan) are concrete, brick and concrete block, plasterboard (Gyprock) and some timbers. The two closest concrete plants supplying commercial-grade concrete are approximately 55km from the site; other Australian-made products are Fibre Cement Sheet and most timbers, assuming the Eastern States. All other materials are assuming coming from Asia with various logistical routes and variations. We calculated our default over sea product produced in Shanghai and shipped to Fremantle Port. We also assume all hot roll steel sections and steel reinforcement products are imported from Asia due to their cost competitiveness.
We acknowledge that due to the complex logistical routes involved in manufacturing Steel sheet products (roofing, cladding and lightweight frames) in Australia, the A1-A3 included the average transport emissions across all states. We assumed the same product supplied to the Eastern State would have much lower transport emissions than Western Australia. As a result, we conservatively include a 4000km rail emission factor in A4 module for Colorbond and 4000km 40t truck emission for Rondo steel products.
Majority of all other materials such as aluminium and glass is either from Asia or Easten state (by truck)
While this is a simplification, we feel it gives us the closest estimate for the exercise without knowing all the details.
Transport mode emission based on the Table 1: Freight emission factors from ‘Upfront Carbon Emissions calculation guide – interim’ of Green Building Council Australia
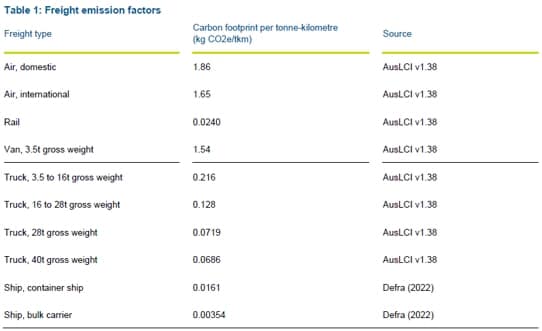
Local supply by small trucks up to 16t: 55km x 0.216 KgCO2e/tkm = 0.01188 kgCO2e/kg
Perth metro supply by truck up to 16t: 300km x 0.216 KgCO2e/tkm = 0.0648 KgCO2e/kg
Australian made product from eastern states with 40t truck: 4000km x 0.0686 KgCO2e/tkm = 0.2744 kgCO2e/kg + local distribution from Perth by 16t truck = 0.3392 kgCO2e/kg
Australian made products from eastern states with rail (for BlueScope steel only): 4000km x 0.024 KgCO2e/tkm = 0.2744 kgCO2e/kg + local distribution from Perth by 16t truck = 0.1608 kgCO2e/kg
Import product from Asia (Shanghai Port): Internal 40t truck of 145km, 9000km container ship, 45km local 40t truck to Warehouse in Welshpool: 190km x 0.0686 KgCO2e/tkm + 9000km x 0.0161 KgCO2e/tkm = 0.157 kgCO2e/kg + local distribution from Perth by 16t truck = 0.222734 kgCO2e/kg
Import product from Israel (Danpalon sheet only): Internal 40t truck of 105km, 28620km container ship, 45km local 40t truck to Warehouse in Welshpool: 150km x 0.0686 KgCO2e/tkm + 28620km x 0.0161 KgCO2e/tkm = 0.157 kgCO2e/kg + local distribution from Perth by 16t truck = 0.535872 kgCO2e/kg
b. Construction process and construction waste emission (module A5a and A5w)
The calculation method for modules A5a and A5w is complex. For example, From page 23 of ‘A brief guide to calculating embodied carbon’ by www.thestructuralengineer.org
The A5w emissions factor accounts for the carbon emissions released during production, transportation, and disposal of wasted material. The factor itself represents the percentage estimate of how much of the material brought to site is wasted (using a waste factor, WF) so that the A5w factor can be multiplied by the same material quantity used for the A1–A3 calculations. The A5w factor is derived by multiplying the WF by the sum of the relevant ECFs:
A5w = WF × (A13 + A4 + C2 + C34)
It is difficult to obtain accurate data for the calculation especially for A5a. Some EPDs provide A5 components, while others do not. We calculated A5a and A5w based on the split on the Table 7 (page 33) of ‘Embodied Carbon & Embodied Energy in Australia’s Buildings’ by Green Building Council Australia and Thinkstep-anz’ for Department of Industry, Science, Energy and Resources, Commonwealth of Australia.
This means our calculation of A5 is based on an average of the Australian construction industry in proportion to A1-A3.
We note the forecast reduction of A5a and between 2019 to 2050 due to the decarbonation of the grids, transportation and construction tools and slight increase A5w.
A5a being 26.19% of A1-A3 in 2019 compared to 3.74% in 2050
A5w being 1.48% of A1-A3 in 2019 compared to 1.63% in 2050
We extrapolate the proportion of A5a and A5w (linear interpolation) for expected construction in 2025: A5a to be 20.66% of A1-A3 and A5w to be 1.52%
4. Result discussion
The total upfront emission is 111 ton CO2 E, which is made up of:
· A1-A3 = 83.8 ton CO2 E
· A4 = 8.7 ton CO2 E or about 10 % of A1-A3.
· A5a = 17.3 ton CO2 E (estimate proportion base on percentage of A1-A3)
· A5w = 1.3 ton CO2 E (estimate proportion base on percentage of A1-A3)
As the building is approximately 540 m2 the emission per m2 is 205kg CO2 which is 20% lower the average refurbishment emission of 255kg CO2/m2
A4 emissions are significantly higher than the national average of 2.13 % of A1-A3. This indicates the transportation impact of a rural project and the lack of local manufacturing in Western Australia.
The calculation also highlights the large impact of concrete (5.5 ton CO2), masonry (3 ton CO2), structure steel (3.6 ton CO2), aluminium glazing (13.7 ton CO2) despite being a small portion of the project in area
· Concrete floor impact: 200kgCO2/m2
· Double clay brick wall: 141kgCO2/m2
· Single 90mm blockwork wall: 57kgCO2/m2
· Aluminium glazing system: 504kg CO2/m2 for double glazed and 452kg CO2/m2 for single glazed. Predominantly contributed from aluminium using a figure from NABER database with the uncertainty factor at 34.2kg CO2/kg. Despite Capral product using LocAL aluminium billet, which is 8kg CO2/kg compared to 12.46kg CO2/kg global average, without EPD, the possible reduction is only 4.46KgCO2 which is about 10% or about 1ton CO2 saving for this project.
Other significant emission contributions are from internal finishes due to their large quantity such as acoustic board lining (5.3 ton CO2), wall tiling (1.6ton), solid core timber door (1.8ton), carpet (1.9 ton CO2), furniture and cabinetwork (11.5 ton CO2) and MEP services (13.1 ton CO2)
Despite this, refurbishing an existing building is still much more economical, both financially and environmentally. It is estimated that the same size new building would emit approximately 291 tons of CO2, or 2.5 times more than refurbishment, not including demolition of the existing building (based on 538 KgCO2e/m2 Table 7 (page 33) of ‘Embodied Carbon & Embodied Energy in Australia’s Buildings’ by Green Building Council Australia and Thinkstep-anz’ for Department of Industry, Science, Energy and Resources, Commonwealth of Australia.)
5. Design consideration in carbon reduction:
Without changing the scope and client requirement of the project, the following actions were taken to reduce embodied carbon emissions in total of 20.7 ton (20% of total emission):
a) Reuse, relocate and refurbish existing timber doors and door frames. 9 doors out of 14 doors and timber frame were existing, resulting in 3.24 tonCO2 saving
b) Using hardwood frames for internal windows and door frames internally instead of aluminium for a saving of 341kg CO2
c) External timber stud and steel stud frame wall instead of double cavity brick wall resulting in 537kg and 1.2 tonCO2 saving
d) Internal timber stud frame wall instead of the single brick wall resulting in 3.8 tonCO2 saving
e) Specify local window aluminium supplier – Capral with LocAL aluminium resulting in approx. 1.3 tonCO2 saving
f) Specify local carpet supplier – GH Commercial with sustainability credentials resulting in approx. 10 tonCO2 saving (emission factor estimated based on EPD in USA of equivalent product)
g) Specify local Vinyl supplier – Forbo with sustainability credentials resulting in approx. 405kg CO2 saving.
Other potential emission savings could be extensive use of timber for the courtyard roof structures. However, with the lack of skilled trade in the industry, it would be cost prohibitive. Other areas are the use of timber for external windows, and doors instead of aluminium. However, with the lack of resources and systems for regular maintenance, external timbers would potentially be problematic for the client. The other alternative would be uPVC doors and windows; however, they are generally not available or warranted for commercial project.
6. Conclusion:
“Strive for Progress, not Perfection”
We are proud to have taken this step despite the difficulty and extra cost to our operation. We strive to be at the frontier in sustainability.
Although our calculations might contain inaccuracies and errors, we trust our figures are within an acceptable margin of error. More importantly, it gives us a clear guide to reducing upfront emissions through reduced, reused, or selected material. It also highlights the low-hanging fruit and immediate actions we can take.
There would be always room for improvement, and we are excited to have developed a database and insights of material and system for our next project in reducing embodied carbon emissions.
The numbers are also valuable in our discussions with our peers, clients, sub-consultants, suppliers, and contractors to move the industry in the right direction.
And finally, the number is our benchmark to measure our progress in the future.
7. References
· The Institution of Structural Engineers (2020). “How to calculate embodied carbon, second edition”
· Green Building Council Australia (2022). “Upfront Carbon Emission calculation guide – interim”
· GBCA and thinkstep-anz. (2021). Embodied Carbon and Embodied Energy in Australia’s Buildings. Sydney: Green Building Council of Australia and thinkstep-anz.
· Meghan Lewis, Monica Huang, Stephanie Carlisle, Kate Simonen. “AIA-CLF Carbon Toolkit for Architects. Part 2: Measuring embodied carbon”
· Meghan Lewis, Monica Huang, Stephanie Carlisle, Kate Simonen. “AIA-CLF Carbon Toolkit for Architects. Part 3: Stategies for reducing embodied carbon”
· Coggin Sustainable Office Solutions. Access 26 Nov 2024. “The Carbon Footprint of Office Funiture: A detail guide. Office Furniture & its Carbon Footprint”. https://www.coggin-sos.co.uk/the-carbon-footprint-of-office-furniture#OfficeFurnitureCarbonFootprint
· Simona Fischer, Lauren Gardner, Emily Gross, Veronica McCracken, Java Nyamjav. MSR Design. “Embodied Carbon in Commercial Furniture: Introducing a calculator, a case study and a new set of baseline”.
· Capral Aluminium. (2024) Whitepaper. “LocAL: Lower-Carbon Aluminium for Australian Manufactures”